True Grit Energy
How much work does it take to complete the True Grit Epic 50-mile mountain bike race?

I completed the True Grit Epic 50-mile mountain bike race on March 16, 2024. This was my second time racing True Grit, and several members of my family raced as well. After the race we were debating how much more work the winners had to do. Did they do more work, or were they just able to do the same work faster (more power)? I was curious, so I thought I'd try to calculate the work needed to complete the course.
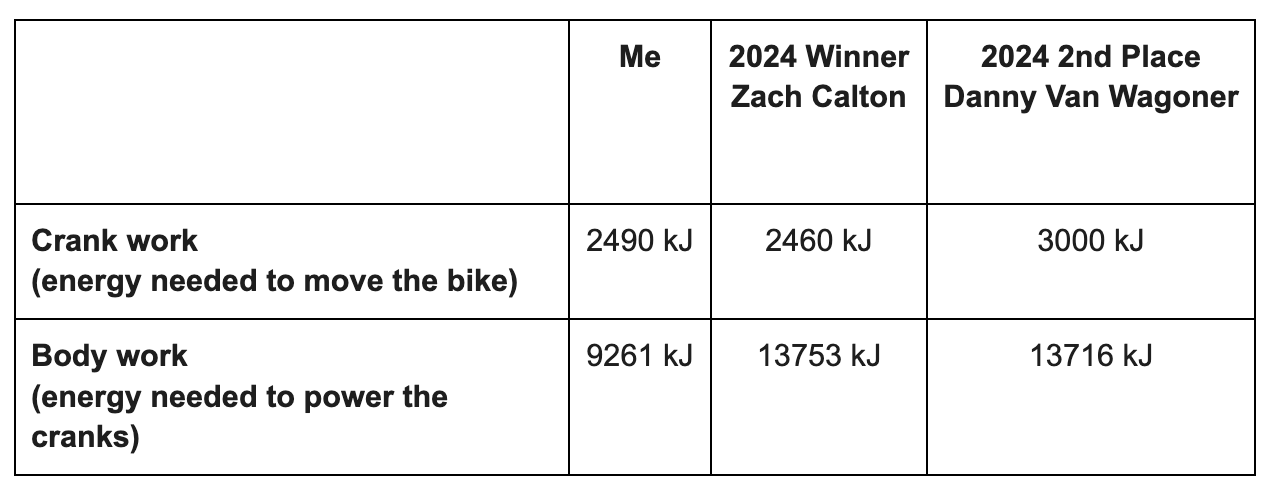
The table below lists my Strava stats for the race alongside the 50-mile 1st and 2nd place winners, Zach Calton and Danny Van Wagoner, respectively. I included the 2nd place winner because his power data was recorded with a power meter. One interesting observation is that my Energy Output was nearly the same as Zach's. Zach's Estimated Average Power was about double mine, which makes sense considering Power = Energy/Time, and the winner finished the race in half my time. Another interesting observation is that the Calories number is 3.7 to 5.6 times greater than the Energy Output, even though they are both calculations of energy.
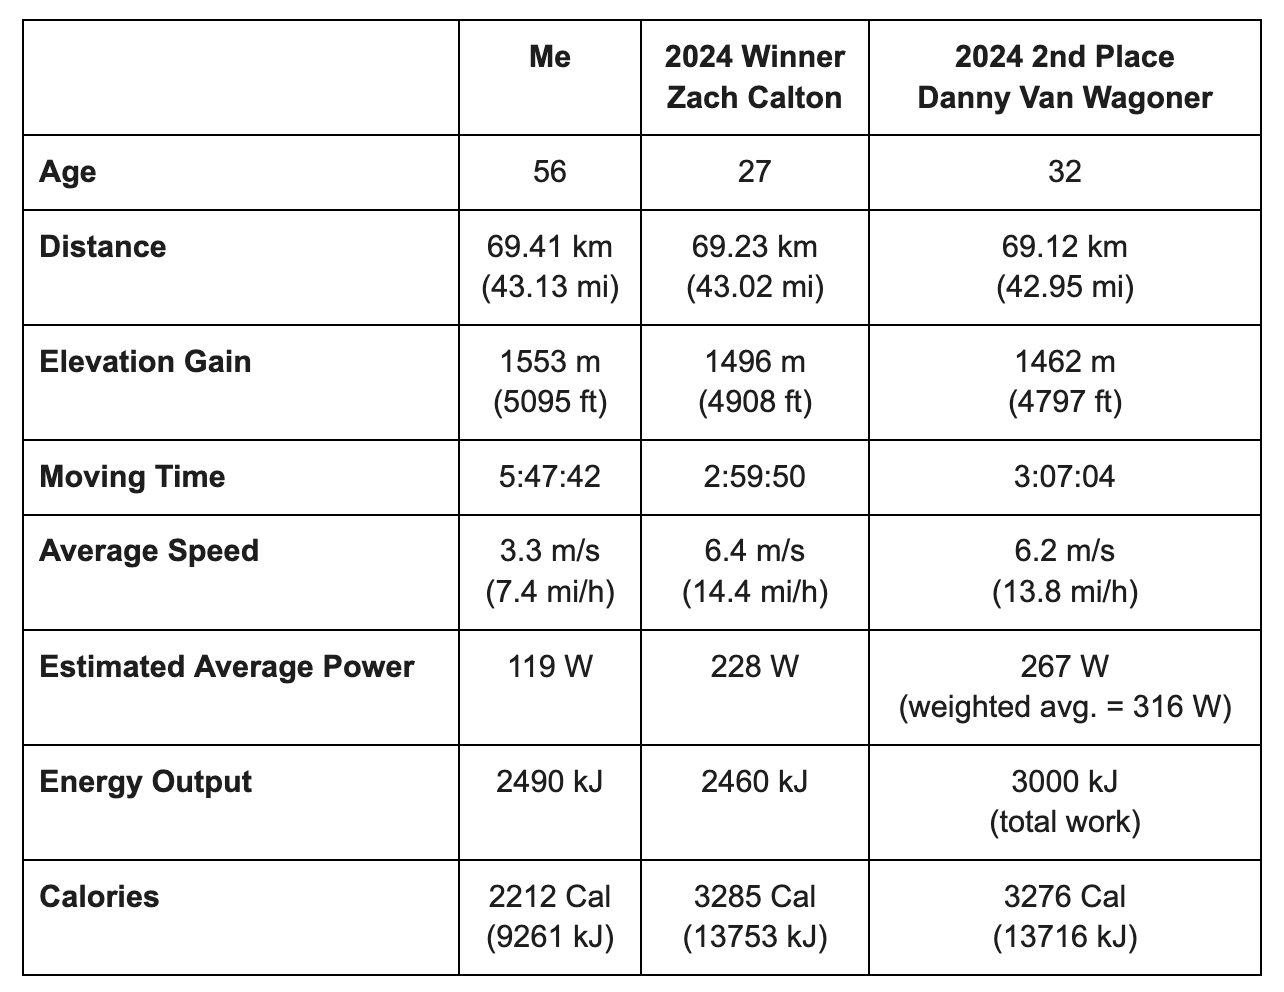
Strava's Estimated Average Power is either the measured power at the cranks via a power meter or an estimate based on your weight, speed, and elevation change. The data for me and Zach are both estimates, while Danny's data was measured by a power meter. Strava then uses this data to estimate the mechanical energy needed to move through the course (Energy Output) or, in Danny's case, the actual Total Work done. Danny's value for Total Work is the benchmark for this analysis since it is based on actual measurements with a power meter at the cranks. I will try to calculate the Energy Output/Total Power for True Grit and compare it to the Strava values.
Strava's Calories is a measure of the energy an athlete burns during an activity. Some of that energy is used to move the cranks, some is lost to inefficiency in our bodies converting fuel to muscle motion, and some is lost to the environment as heat (convection, sweat, and respiration). Therefore, Calories should be higher than Energy Output/Total Work.
Energy Output/Total Work
Consider the bike and the rider as an isolated system. The total energy contained within the system boundary can be given the symbol E and is made up of the kinetic energy (KE), the potential energy (PE), and the internal energy U:
At the start of the race, the kinetic energy is zero because the system is at rest. The potential energy is also zero if we assume the start line is the reference plane. The only energy in the system is the internal energy, i.e. chemical energy stored in our bodies and the food we carry with us to eat. We are interested in the amount of energy that crosses our system boundary as we convert our internal energy into motion around the course.
It is useful to define work as an energy transfer across the system boundary in an organized form such that its sole use could be the raising of a weight. In mathematical terms, the amount of work W done in moving through a differential distance ds is
where the center dot denotes the dot product. The work done over a finite path between points a and b is
where F is the force in the direction s. Note that unless the path is specified from the initial to the final state of the system, we are not able to calculate the work done. Therefore, work is an inexact differential quantity in mathematics. The value of work depends on not only the initial and final states of the system but also the path followed.
Energy that crosses the system boundary because of a temperature difference falls into a separate category. This energy transfer is not work, since we cannot envision a way in which its sole effect is the raising of a weight. We thus define this disorganized form of energy that crosses the system boundary because of a temperature difference between the system and its surroundings as heat transfer.
Given these two categories, we can think of all the sources of energy transfer relevant to our system:
Gravity Work – the energy needed to overcome the force of gravity as we traversed the course
Drag Work – the energy needed to overcome wind resistance as we moved around the course
Rolling Resistance Work - the energy needed to overcome the force resisting the motion of our wheels rolling over the ground and the many obstacles on the True Grit course
Friction Work – the energy needed to overcome friction between moving components of the bike (wheel axle bearings, crank bearings, pedal bearings, chain links, etc.)
Heat Loss – the energy we expend keeping our body warm, sweating, and respirating
Efficiency Loss - the energy we waste converting fuel in our bodies to muscular motion at the cranks
The Total Work for this analysis is just the work delivered at the crank (1-4 above). It neglects heat loss and efficiency losses (5 and 6).
1. Gravity Work
The work done by my system on the surroundings to overcome gravity can be represented by
The force due to gravity is the system mass (m) times gravitational acceleration (g), and is not a function of position on the course (neglecting the minor changes in g with elevation). We only need to consider the distance moved vertically since gravity only acts in the vertical direction. Thus the integral of ds is the vertical distance traveled, h. We do not consider the work done by gravity on our system during the descent because this energy does not transfer across the system boundary (we cannot absorb the energy during the descent for use later).
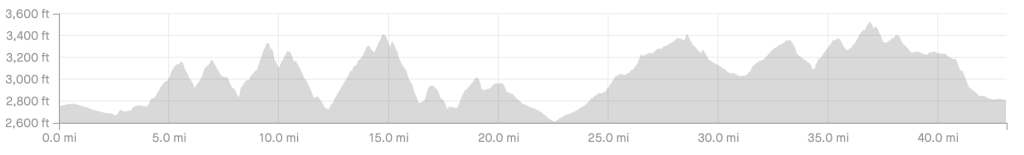
The image below shows the race elevation change from Strava. My total elevation gain was h = 1553 m (5095 ft). My mass, including the bike and my pack, is about 90 kg. Thus the energy I needed to overcome gravity was 1371 kJ. This value represents only about 15% of the estimated energy consumed during the race.
If I assume Zach and Danny have a mass of 90 kg, their gravity work is 1321 kJ and 1291 kJ, respectively.
2. Drag Work
The work done by my system on the surroundings to overcome drag can be represented by
Aerodynamic drag is the resultant force due to pressure and shear stress on a body’s surface as it moves through the air. Drag due to pressure is called form drag because it depends on the shape of the body. Drag due to shear stress is called skin friction drag because it depends primarily on the amount of surface in contact with the fluid. In general, drag force can be represented by
where rho is the air density, V is relative velocity between the body and the fluid (air), CD is the drag coefficient, and A is a representative area depending on the type of drag being considered.
Let's model our system as a flat plate oriented perpendicular to the approaching airflow. The drag on a normal plate is due to pressure only (form drag) and is insensitive to Reynolds number. If we assume the plate width is equal to our shoulder width (about 0.5 m), and the plate height is equal to our shoulder height (about 1.5 m), we can estimate the drag coefficient to be about 1.1.
The velocity V is a function of position on the course, as shown below from Strava.
Most of the high velocity periods were experienced during the descents where the drag work may have been completely overcome by the effect of gravity. Most of the climbing was done at low velocity where the drag work would be low. Thus, most of the drag work would be experienced on the relatively flat sections of the course where our velocity might be close to the average. If we assume the velocity is constant for the entire course, the drag work equation reduces to
where L is the length of the course and Vavg is our average velocity. Now I have to make a few more assumptions to do the calculation.
Assume the average air temperature was 20 C and the elevation was 1000 m (air density = 1.112 kg/m^3)
Assume there is no skin drag from the bike, and all the drag comes from form drag
Assume the wind velocity is zero (conditions were calm during the race)
The resultant drag force for me is about 5 N and the drag work is about 347kJ. The drag work for Zach and Danny is about 1304 kJ and 1224 kJ, respectively. Their drag work is four times higher than mine due to the velocity squared term.
3. Rolling Resistance Work
The force needed to overcome rolling resistance is given by
where CRF is the coefficient of rolling friction. CRF is a function of both the force (rider mass) and the velocity. Using the data published by bicyclerollingresistance.com for MTB tires rolling on a smooth steel drum, I estimate CRF to be between about 0.0034 and 0.012 for each tire. This is the range of CRF values for all mountain bike tires tested at 25 psi. Thus the rolling resistance force for both tires is between about 3 N and 10.6 N, assuming that one-half of my mass is carried by each tire. Multiplying by the distance traveled gives Rolling Resistance Work of between 208 kJ and 735 kJ.
4. Frictional Work
A simple model is to assume 5% of crank work is required to overcome friction. This seems like a reasonable assumption.
Adding it all up...
The table below shows the calculated total work for each athlete from the four work components listed above. I also calculated the average power as
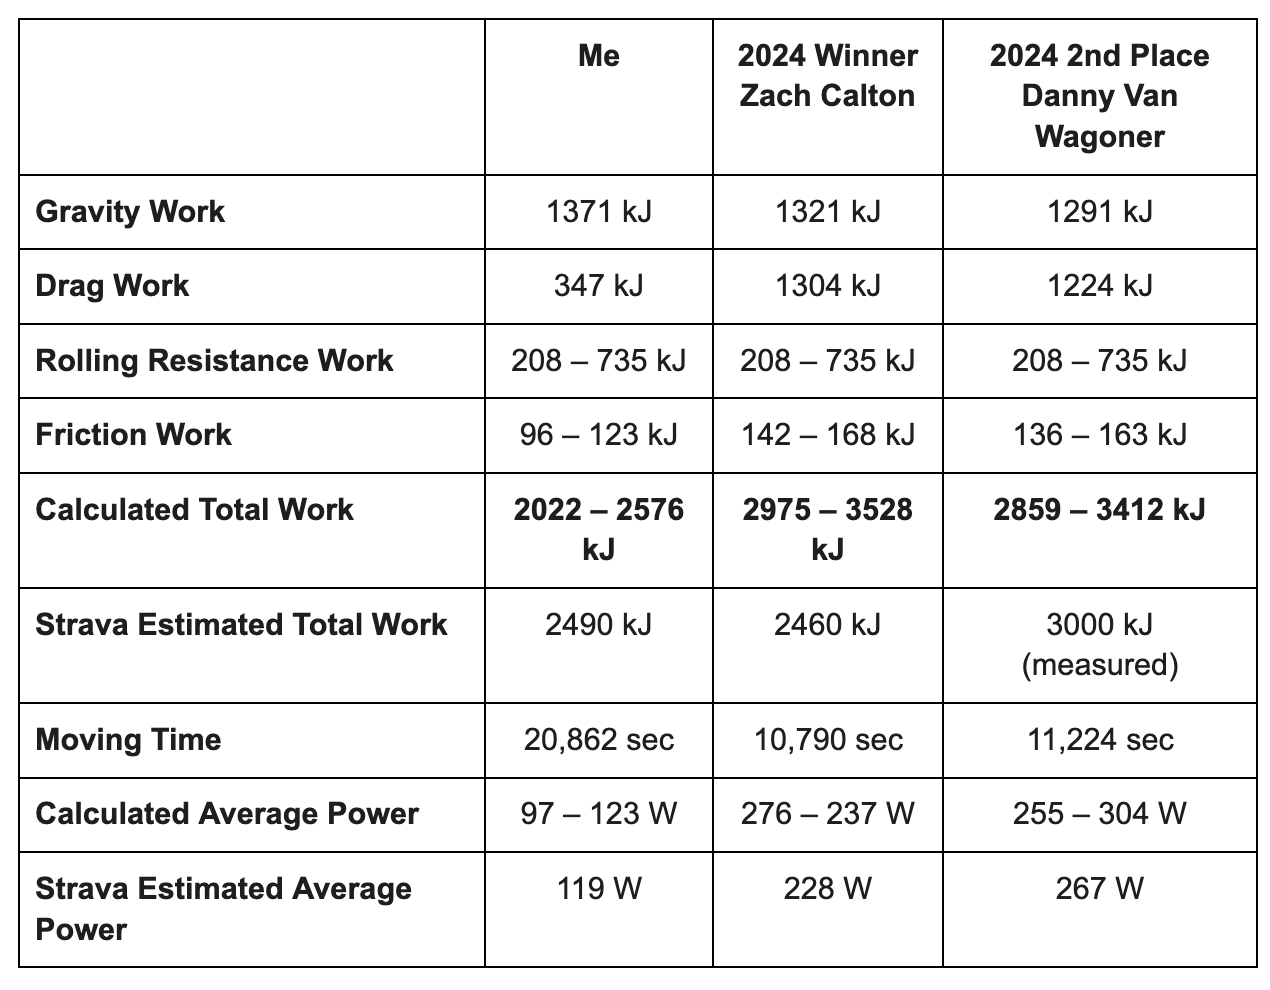
Danny's measured Total Work of 3000 kJ is in between my calculated work estimates of 2859 and 3412 kJ. Thus, my calculations do a reasonably good job estimating the actual work. Strava's estimate for my Total Work is also in between the calculated ranges. Zach's calculated work is higher than Strava's estimate. Perhaps Strava doesn't do a good job estimating work for elite athletes? The calculated power values are also in the range for both me and Danny and high for Zach. Overall I think my calculations are reasonably accurate and capture the main components of the work done.
Back to the original question of how do I compare to the winners. It appears that the major difference is the form drag since the work scales as the velocity squared. It would also seem reasonable to assume the winners have lower rolling resistance. For example, Danny was riding a hard-tail with race tires, and I was riding a full-suspension bike with wide knobbys.
Now look at the Strava data for Calories, or the amount of energy the athlete had to burn to deliver the work needed to move around the course. All of this extra energy was lost to the environment through heat transfer, sweat, and respiration. This gives me a greater appreciation for the effort it takes an elite athlete to win a race like True Grit.